

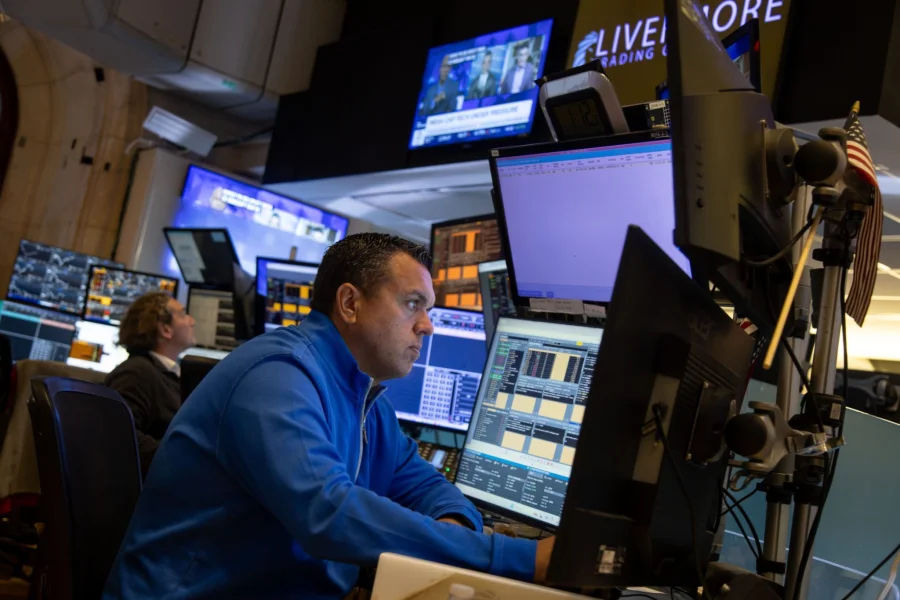
The calm in the broader stock market is masking a storm brewing in its most celebrated corner. While the S&P 500 has moved with relative composure, the technology sector is flashing a volatility signal not seen since the dot-com bust of 2002.
The Divergence That Has Analysts Talking
The Cboe NDX Volatility Index, which measures the cost of options contracts tied to the Nasdaq 100 Index, has been climbing steadily this year and is now hovering near 27. That reading represents the highest level since 2002 when compared to the Cboe VIX Index, the more widely watched gauge of expected volatility for the S&P 500.
This gap is unusual. Typically, tech volatility and broader market volatility move in tandem. But today, the NDX is screaming while the VIX whispers.
Why This Gap Matters for Everyday Investors
For the average investor, this divergence is not just a technical curiosity — it is a warning signal. When volatility expectations for tech stocks rise sharply while the broader market stays calm, it suggests that professional traders are hedging aggressively against a potential selloff in the very stocks that have driven market gains.
If you hold mutual funds or ETFs heavy on tech — think Nifty 50 or Nasdaq-linked products — this volatility could soon translate into sharper daily swings in your portfolio.
How We Got Here: The 30% Rally and Rising Anxiety
The Nasdaq 100 has surged roughly 30% from its late March lows, fueled by optimism around artificial intelligence, earnings resilience, and a resilient US economy. But that rally has also concentrated risk. According to market analysts, positioning in tech stocks has become "excessive," with many hedge funds and institutional investors piling into the same names.
As Maxwell Grinacoff, head of US equity derivatives at a major bank, put it: "This is pretty astounding." The comment underscores the growing unease among derivatives experts who track these signals for a living.
Who Is Affected by This Tech Volatility Surge
This is not just a Wall Street problem. Indian investors, who have increasingly allocated to US tech stocks via mutual funds, ETFs, and direct investments, are directly exposed. The Nasdaq 100 is a benchmark for many global tech funds popular in India.
Retail traders using options or leveraged products face even higher risk, as the cost of hedging has risen sharply. For long-term investors, the message is simpler: expect bumpier rides ahead.
What Market Experts Are Saying
Maxwell Grinacoff's assessment is backed by data. The NDX Volatility Index's rise relative to the VIX is the widest in over two decades. Analysts at multiple firms have flagged that the options market is pricing in a higher probability of sharp moves in tech stocks than at any point since the dot-com collapse.
Some experts caution that this could be a self-fulfilling prophecy — if enough traders hedge, the hedging itself can amplify volatility.
What This Signal Really Means
The NDX-VIX gap is not a prediction of a crash. It is a measure of fear priced into options. But historically, such extreme divergences have preceded periods of heightened turbulence. The dot-com comparison is particularly striking because it reminds investors that even the most exciting rallies can unwind quickly when positioning becomes too crowded.
The key question: Is this a buying opportunity in disguise, or the calm before a storm?
Confirmed Facts vs What Remains Unclear
Confirmed: The Cboe NDX Volatility Index is near 27, the highest relative to the VIX since 2002. The Nasdaq 100 has rallied 30% from late March. Maxwell Grinacoff has publicly called the divergence "astounding."
Unclear: Whether this volatility will lead to a correction or simply reflect normal hedging activity. The exact trigger for a potential selloff — if any — remains unknown. Some analysts believe the signal is overblown.
Why Tech Stocks Are Different This Time
Unlike the dot-com era, today's tech giants — Apple, Microsoft, Nvidia, Alphabet — generate real earnings and cash flows. But that does not make them immune to volatility. In fact, their sheer size means that any rotation out of tech can have outsized market impact.
The concentration risk is real: the top five Nasdaq 100 stocks account for a larger share of the index than at any point in history.
Risks and Balanced View
Bullish case: The volatility signal may simply reflect healthy hedging by institutions, not a looming crash. Tech earnings remain strong, and AI-driven demand could sustain the rally.
Bearish case: Excessive positioning, a stretched rally, and rising volatility expectations are classic precursors to a correction. A shift in Fed policy, geopolitical shock, or earnings disappointment could trigger a sharp unwind.
Neutral view: The divergence is a yellow flag, not a red one. Investors should review their exposure but not panic.
Wider Trend: The Fragility of Market Concentration
This story fits a broader pattern: markets are increasingly driven by a narrow set of mega-cap tech stocks. When those stocks wobble, the entire market feels it. The NDX-VIX gap is a symptom of this fragility, not its cause.
Globally, regulators and fund managers are debating whether concentration risk has reached dangerous levels. This volatility signal adds urgency to that conversation.
Practical Steps for Investors
If you are invested in tech-heavy funds or stocks, consider these steps: review your asset allocation, ensure you are not overexposed to a single sector, and avoid making emotional decisions based on short-term volatility. For options traders, the cost of hedging is high — plan accordingly.
Long-term investors may see this as a chance to rebalance rather than exit.
What Could Happen Next
If the Nasdaq 100 continues to rally, the volatility gap may narrow as the VIX catches up. But if sentiment shifts — due to a disappointing earnings season, a hawkish Fed, or geopolitical tensions — the tech sector could see a sharp correction. The options market is already pricing in that possibility.
For now, the signal is flashing amber.
Our Take
The NDX-VIX divergence is one of the most striking market signals in years. It does not guarantee a crash, but it does demand attention. Investors who ignore it risk being caught off guard. Those who respect it can use the information to make smarter, more disciplined decisions. In a market driven by a handful of stocks, volatility in tech is volatility for everyone.
Frequently Asked Questions
What is the Cboe NDX Volatility Index?
It is a measure of expected 30-day volatility for the Nasdaq 100 Index, calculated using options prices. A higher reading means traders expect larger price swings in tech stocks.
How does NDX compare to the VIX?
The VIX measures expected volatility for the S&P 500. The NDX is specifically for tech-heavy Nasdaq 100 stocks. When NDX rises much faster than VIX, it signals that tech volatility is outpacing the broader market.
Should I sell my tech stocks because of this signal?
Not necessarily. The signal is a warning, not a sell order. It suggests higher risk of sharp moves, but long-term investors should focus on fundamentals and diversification rather than short-term volatility indicators.
Why is this compared to the dot-com bust?
The NDX relative to VIX is at its highest since 2002, which was the aftermath of the dot-com crash. The comparison highlights how extreme the current divergence is, though the underlying fundamentals are very different today.